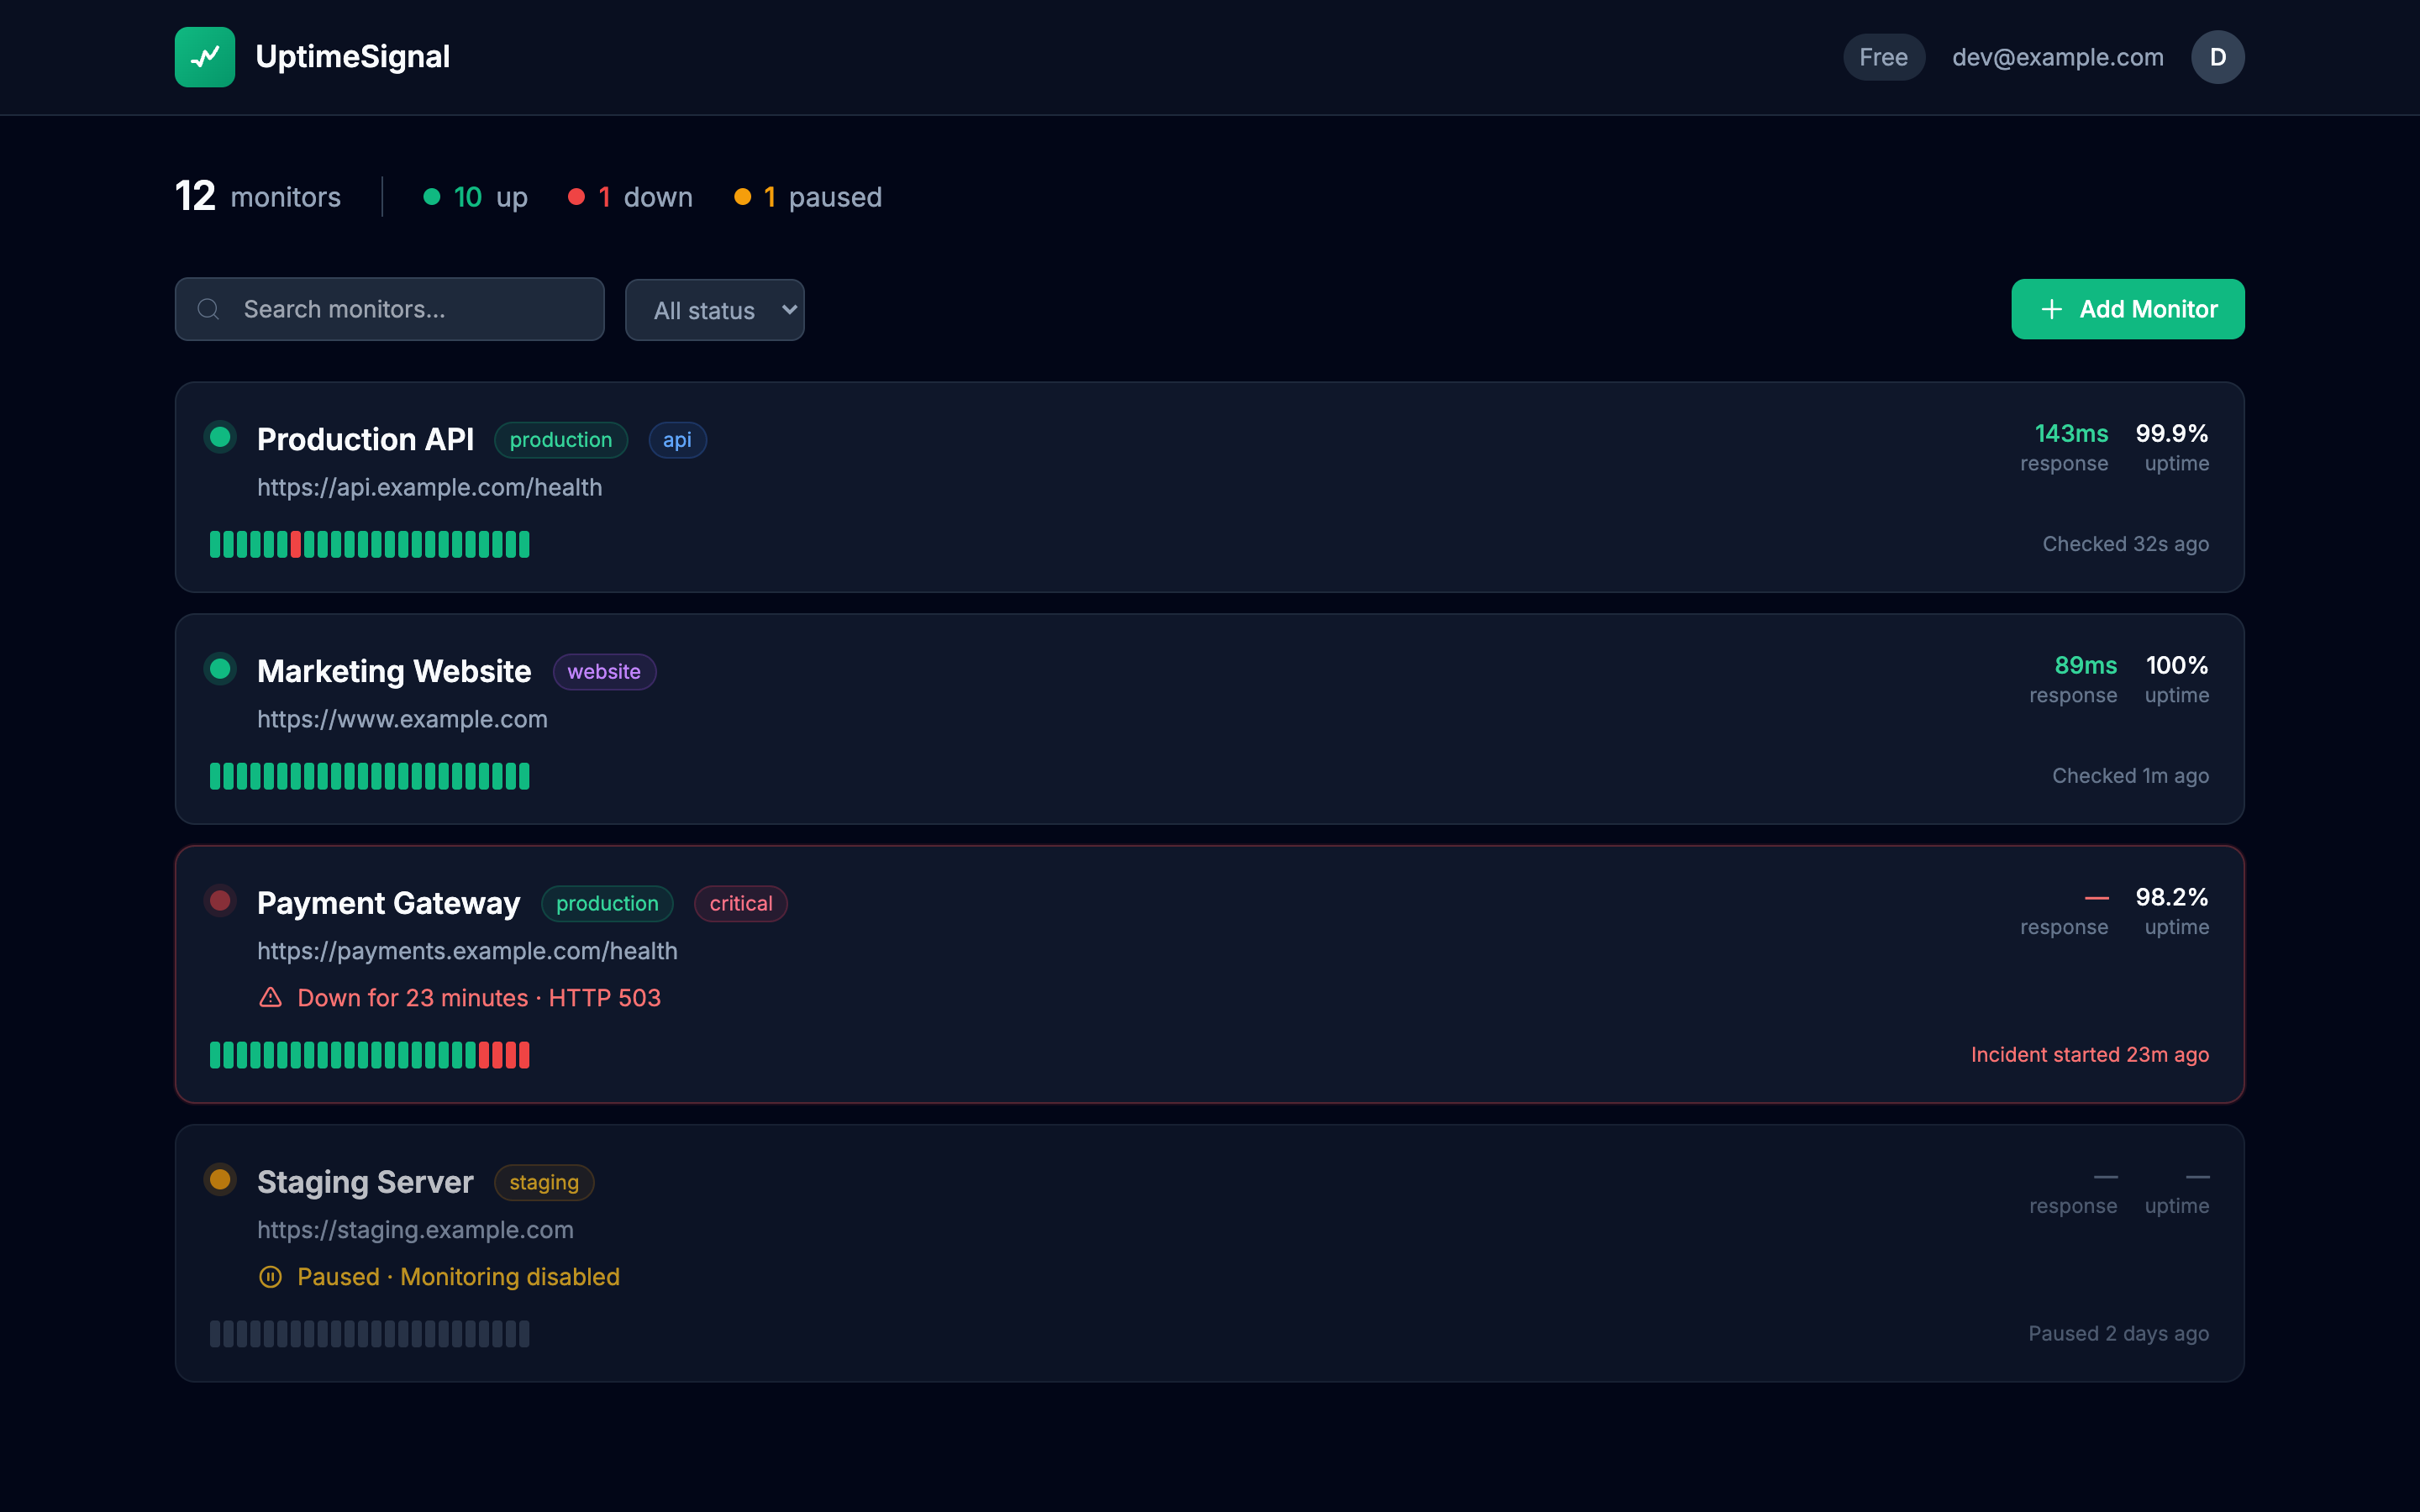
See all your endpoints at a glance
Status, response times, uptime history. One dashboard.
Your internal metrics say everything's fine.
Your users disagree.
Synthetic monitoring checks your endpoints from outside your infrastructure -- like a user would. Before they complain. UptimeSignal sends automated HTTP requests to your APIs and websites on a schedule, and alerts you the moment something breaks.
25 monitors free. No credit card required.
[US] app.yourapp.com        200 OK   (142ms)
[EU] app.yourapp.com        200 OK   (189ms)
[US] api.yourapp.com        Timeout  (30000ms)
→ Alert sent to [email protected]Synthetic monitoring is a proactive testing approach that simulates user interactions by sending automated requests to your endpoints from external locations on a schedule. Instead of waiting for real users to encounter problems, synthetic monitoring actively tests your services and alerts you the moment something fails.
Think of it as having a robot user that constantly checks if your site is working -- from outside your network, exactly like your real users would access it. The "synthetic" part means the traffic is simulated (generated by a monitoring tool), not organic (coming from actual users).
This is the most common type of uptime monitoring. Every major tech company uses synthetic monitoring to ensure their services are available. If you've ever seen a company's status page show a service as "operational," that status is likely being verified by synthetic checks running every minute.
These are complementary approaches, not competing ones. Understanding the difference helps you choose the right tool for each use case.
Which should you use?
Start with synthetic monitoring. It's the foundation of any monitoring stack because it works immediately, requires no code changes, and catches the most critical issues (is my service up?). Add RUM later when you need to optimize real-world performance and understand user experience across different devices and networks.
UptimeSignal is synthetic monitoring built for developers. We check your endpoints before your users do.
How developers and engineering teams use synthetic monitoring in practice.
Monitor your own APIs and third-party APIs you depend on (Stripe, Shopify, GitHub, OpenAI). Get alerted when any API in your stack goes down, so you can activate fallbacks or notify users.
Common for: SaaS companies, e-commerce platforms, AI-powered apps
After every deployment, your synthetic monitors verify that key endpoints are still responding correctly. If a deploy breaks something, you know within 1-5 minutes instead of waiting for user reports. Think of it as a continuous smoke test running in production.
Common for: Teams with frequent deploys, CI/CD pipelines
Expired SSL certificates cause browser warnings that scare away users and break API integrations. Synthetic monitoring validates your SSL certificate on every check and alerts you before it expires. No more scrambling to renew at the last minute.
Common for: All production websites and APIs. Also try our free SSL checker.
Monitor every external service your application depends on: payment processors, email providers, CDNs, auth services. When a dependency goes down, you know immediately and can show the right error messages to users instead of generic failures.
Common for: Any app with external dependencies (which is every app)
Monitor staging, pre-production, and production environments. Catch issues in staging before they reach production. Verify that production matches staging after deploys. Ensure environment-specific configurations (database connections, API keys) are working.
Common for: Teams with multiple environments and promotion workflows
Track uptime percentages to verify SLA compliance. Synthetic monitoring gives you objective, third-party evidence of your service's availability. This data is essential for enterprise customers who require uptime guarantees in their contracts.
Common for: B2B SaaS, enterprise software, managed services
Status, response times, uptime history. One dashboard.
Internal monitoring tells you your servers are running. Synthetic monitoring from outside your network tells you users can actually reach them. Here's what only external monitoring catches.
Email, Slack, Discord, Telegram, and webhook alerts within 60 seconds of detecting failures. Recovery alerts when you're back online. You choose how and where you get notified.
Your server is fine, but users can't reach it. DNS propagation delays, CDN misconfigurations, routing problems -- you'd never know from inside your network. External synthetic checks catch these because they traverse the same path your users do.
Expired certificates, misconfigured chains, renewal failures. Your internal tools might skip SSL validation. Users' browsers don't. Synthetic monitoring validates SSL on every check, exactly like a browser would.
Works from your office, fails for users elsewhere. Load balancer misconfigurations, regional outages, ISP peering issues. These problems are invisible from inside your infrastructure but obvious from external monitoring.
UptimeSignal is purpose-built for developers who need reliable synthetic monitoring without the complexity of enterprise tools. Here's what makes it different.
Your checks run on Cloudflare Workers, which means they execute at the edge -- close to your users, not in a single data center. This gives you a more realistic picture of user-facing availability than monitoring from a single location in Virginia.
Each synthetic check verifies the entire request lifecycle: DNS resolution, TCP connection, TLS handshake, HTTP request, and response validation. We don't just check if the port is open -- we verify your service returns the expected response.
When a check fails, you get alerted in under 2 minutes via email, Slack, Discord, Telegram, or webhook. Recovery alerts tell you when you're back online. No more checking dashboards -- the alert comes to you.
Enterprise synthetic monitoring tools require agents, complex configuration, and expensive per-check pricing. UptimeSignal is a web app: enter a URL, set your check interval, and you're monitoring. It takes 60 seconds to set up your first monitor.
Three steps. Under 60 seconds.
Any URL you want to monitor. Websites, APIs, webhooks, health check endpoints. Add custom headers for authenticated endpoints.
Email, Slack, Discord, Telegram, or webhook -- within 2 minutes. Plus a recovery alert when it's back.
Every check exercises the full request lifecycle, just like a real user.
Detect 4xx and 5xx errors before your users do. Alert on unexpected status codes that indicate server errors, auth failures, or missing resources.
Catch slowdowns before they become outages. Track response time trends over time and set custom thresholds for alerting on degraded performance.
Get warned before your SSL expires. Validates the full certificate chain and checks for common TLS configuration issues that would cause browser warnings.
DNS failures, propagation delays, and misconfigured records. If users can't resolve your domain, they can't reach your service -- and you need to know immediately.
Refused connections, network unreachable, and endpoints that hang without responding. These issues are invisible from inside your infrastructure.
Certificate chain problems, protocol version mismatches, and cipher suite issues that real browsers would reject but internal tools might ignore.
Most synthetic monitoring tools are built for ops teams and enterprise IT. They're complex, expensive, and require agents or dedicated infrastructure. UptimeSignal is different.
There's nothing to install, configure, or maintain. Sign up, add a URL, and your synthetic monitoring is running. We handle the infrastructure (Cloudflare Workers), the scheduling, and the alerting. You focus on building your product.
Enterprise synthetic monitoring tools charge $50-500/month for a handful of checks. UptimeSignal gives you 25 monitors free, and unlimited monitors for $10/month (billed annually). No per-check fees, no per-seat pricing, no surprise overages.
Monitor websites, REST APIs, GraphQL endpoints, health check URLs, webhook receivers, and more. Add custom headers for authentication (Bearer tokens, API keys). Set expected status codes and response body validation. If it speaks HTTP, you can monitor it.
Get alerted via email, Slack, Discord, Telegram, or webhook. Most developers live in Slack and Discord -- not in a monitoring dashboard. Alerts go directly to where you'll see them, not to a tool you have to remember to check.
No per-monitor fees. No per-check fees. Unlimited monitors for $10/month.
Get started with essentials
For serious monitoring
25 monitors free. No credit card required.
We'll send you a magic link. No password to forget.
Also see: API Monitoring · Uptime Monitoring